Your prompt is 3% of the tokens
One planning run cost 2.40M tokens and 97% of them were cache traffic. Prompt-tightening acts on the 3%. The fix is architectural, and here's the break-even that tells you when it's worth building.

One run of our planning skill cost 2.40M effective-billable tokens. Input plus output came to 0.07M of that. About 3%.
The other 97% was cache traffic.
That number is measured off the transcript of a production agent fleet (a set of Claude Code skills that plan, review, and merge real tickets against Jira), and it changed where I look first when an agent run gets expensive.
Where does an agent's money actually go?
Here's a single autonomous run of /plan, our planning skill, measured on its executor thread. Sonnet, 6 July 2026.
| component | raw tokens | billable |
|---|---|---|
| input | 39,003 | 0.04M |
| cache-creation | 1,172,979 | 1.47M |
| cache-read | 8,697,896 | 0.87M |
| output | 29,957 | 0.03M |
| total | 2.40M |
One run, one thread, our own setup. Observed, not a controlled benchmark, and n=1 on both sides of the before/after below.
Effective-billable means input + 1.25 × cache-creation + 0.1 × cache-read + output, using the published five-minute cache multipliers. (A one-hour cache writes at 2×.) It's in input-token equivalents, so output is weighted at 1× even though it bills at 5× on this tier. Dollar-weighted the split is about 92/8 rather than 97/3, which doesn't change the argument but is the number to use if you're reconciling against an invoice. (Components are rounded; totals come from the unrounded figures.)
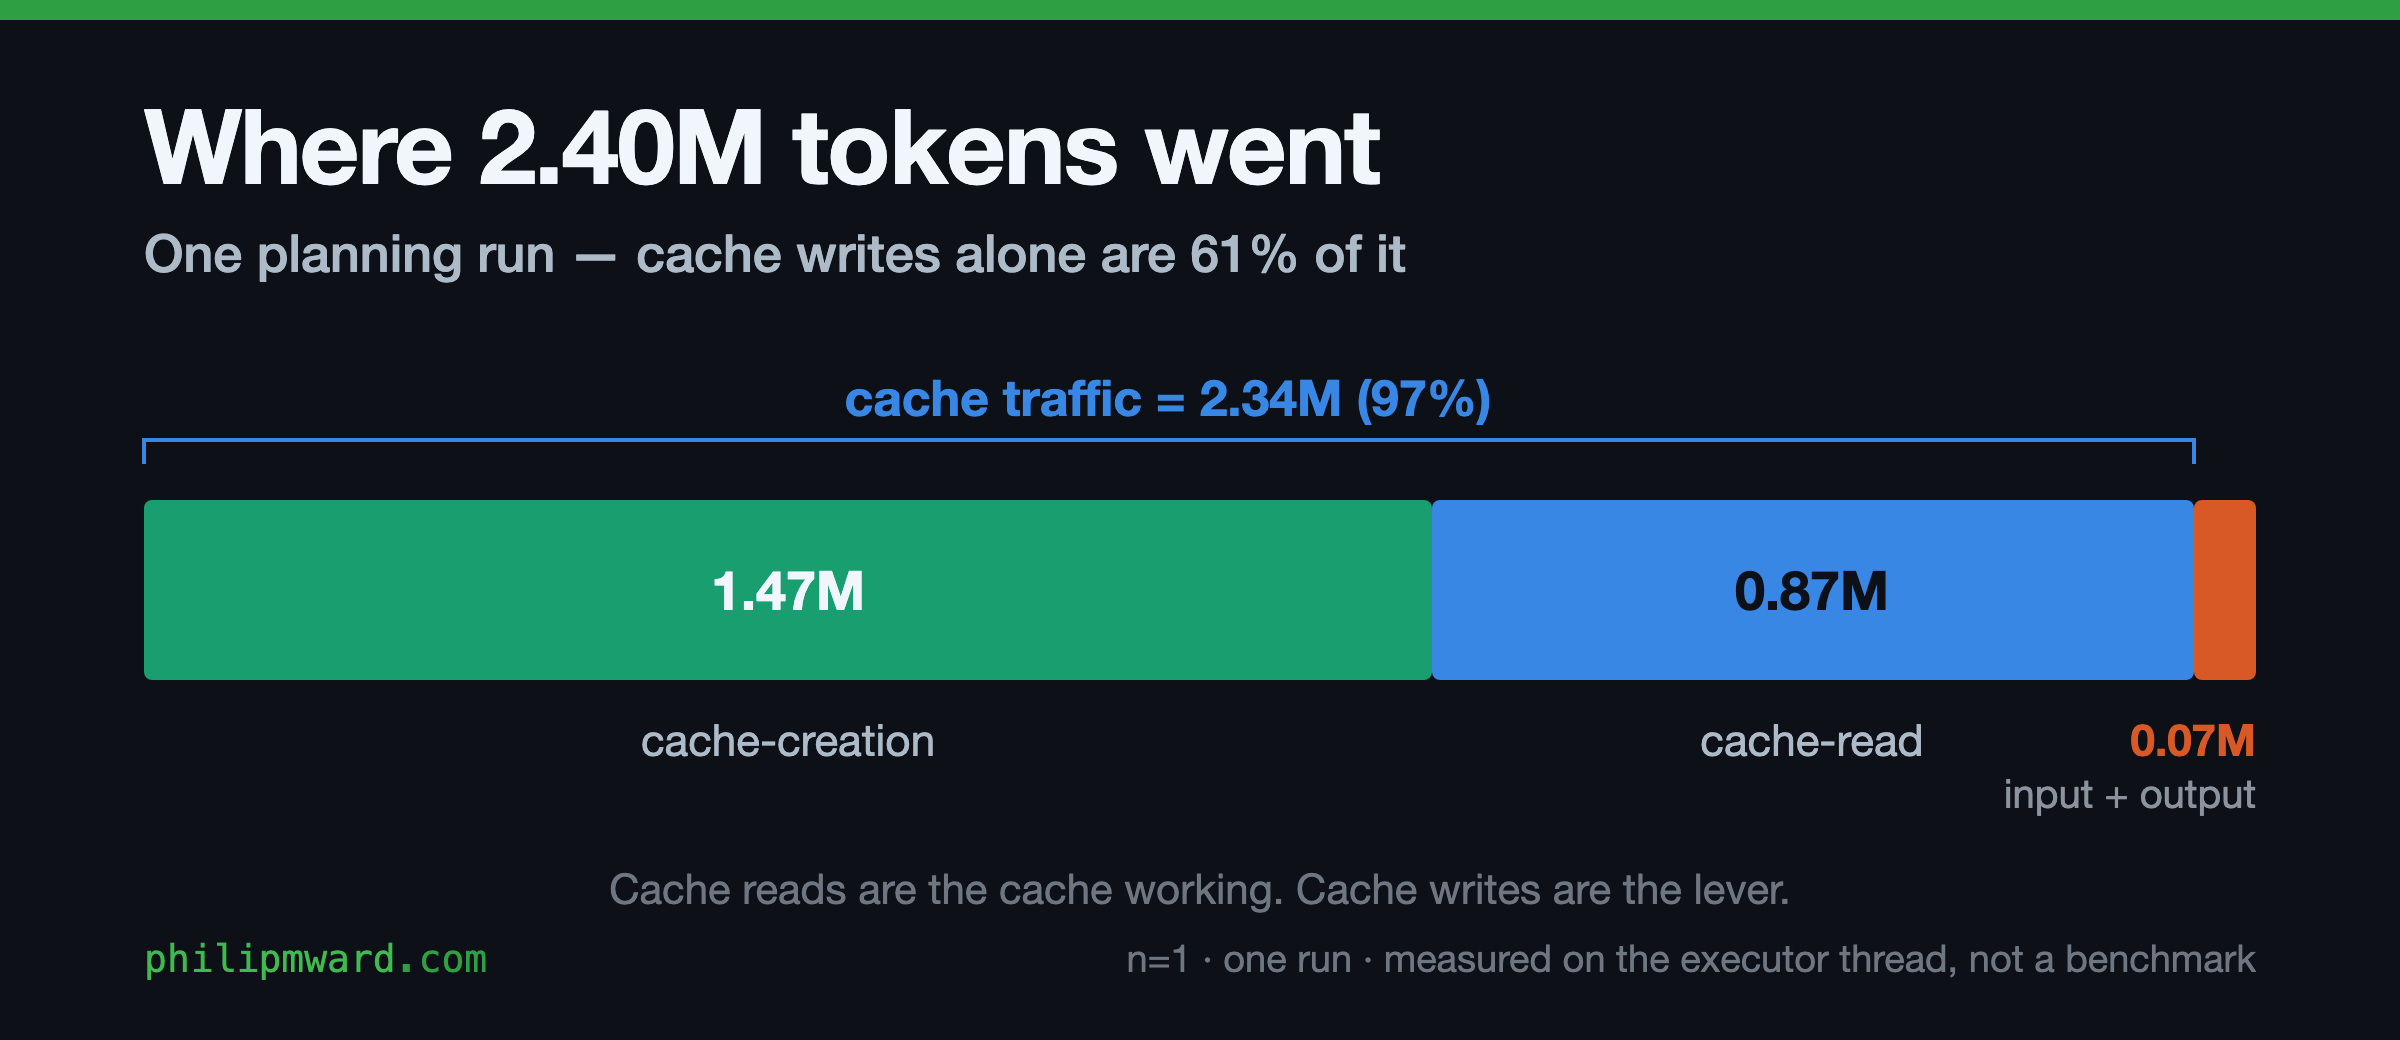
Not all of that 97% is a problem. Cache reads bill at a tenth of the input rate, and a big read number is the cache doing its job. That's 36% of this run.
Nor is cache creation waste in itself. Add up what this run would have cost with no cache at all — every one of those 9.9M prompt tokens at the full input rate — and it bills near 10M against the 2.40M it actually cost. The cache bought a 4× discount. The question was never whether to cache. It's how big a thing you're paying 1.25× to write, and how many times you write it.
That's where the alarming number is. Cache creation is 1.47M, or 61% of the bill. Every fresh context and every fat payload buys another cache write. 97% is the headline. 61% is the lever.
There's also a trap in the API response that makes this easy to miss. The field called input_tokens reports only the uncached remainder. Your real per-call prompt size is input_tokens + cache_creation_input_tokens + cache_read_input_tokens. Read the first number alone and you're looking at under 2% of this run's bill.
Which surfaces a collision worth naming, because it's the obvious objection to the title. Two different things get called the prompt. The words you hand-write are the 3%. Everything that enters the context — instructions, tool schemas, fetched payloads — is the other 97%, and all of it is prompt material you pay 1.25× to write into cache. So if what's fat is your system prompt or a sprawling skill definition, then yes, tightening it is exactly your lever. In our case it wasn't. The thing being written over and over was a Jira payload nobody typed, and no amount of rewording reaches that. What you admit into the context does.
The audit loop re-sends the same fetch, up to six times
/plan pulls a Jira issue at the start of every run. It doesn't read it once. The audit loop spawns reviewer sub-agents (an auditor and a judge) as many as six times across three rounds, and every spawn re-receives the same issue text as evidence. Each sub-agent has its own context, and the payload sits behind a different prefix in each one, so it's a different cache key rather than a shared hit. Six spawns, six writes, one payload.
One caveat on sequencing, because it cuts against the number. None of those spawns are in the 2.40M. That figure is the executor thread alone, so the fan-out sits outside what I measured, which means the real bill is higher than what I'm showing you. By how much, I haven't measured.
This is the context tax on the fetch side. A long-running agent re-pays for its context every turn. A fan-out agent re-pays for its payload every spawn.
What I built
Two changes. Neither is a prompt.
The first is a throwaway extraction sub-agent. Instead of /plan calling getJiraIssue and swallowing the bundle into its own context, it delegates to a jira-issue-extractor sub-agent. That agent makes the call inside its own disposable context, projects the issue down to slim markdown, and returns only that. The fat payload never crosses back to the caller. I call this conclusion, not payload, and it's the reusable idea in this post.
The second is a skill-side disk cache. The slim projection gets written to ~/.claude/cache/jira/{TICKET}.json, and the next touch of the same ticket reads from disk. It expires on a four-hour TTL, and the agents in our fleet that modify Jira invalidate the cached key on write, so staleness only bites for edits made outside the fleet.
Then I re-ran the identical /plan on the same ticket at the same tier and measured the executor thread again. The before run had neither change — it called getJiraIssue directly and swallowed the raw bundle into its own context. The after run had both, and hit the disk cache. So both changes are in the delta below, and what moved the 44% is the payload itself going from raw bundle to slim projection, not the cache on its own.
| before | after | delta | |
|---|---|---|---|
| cache-creation slice | 1.47M | 0.82M | −0.65M (−44%) |
| executor billable | 2.40M | 1.50M | −0.90M (−37%, optimistic) |
| cache-read | 0.87M | 0.62M | −0.25M (−29%) |
| input + output | 0.07M | 0.07M | flat |
Run-to-run variance is the first caveat. The after run converged in one clean audit round; the before run asked three clarifying questions. Fewer rounds means fewer turns and less of everything, so some of that 37% is variance. I trust the 44% on the cache-creation slice more, because the payload shrink shows up in every turn's cached prefix regardless of turn count. But fewer rounds shrink that slice too, so it isn't clean either. Cache-read fell partly because a smaller prefix is a smaller thing to re-read, and partly because there were fewer turns to re-read it on.
The second caveat cuts harder. The extractor never ran in either measured run — the before run didn't have one, and the after run was a cache hit, so it read from disk. That means this delta shows what a slim payload buys you without ever paying for the extraction that produces it. It's the best case, not the average one. The extractor's production cost is unmeasured, and it comes back below.
What fields= actually buys
I built the extractor on a premise that turned out to be false: that you couldn't ask the API for less. A probe on 6 July returned byte-identical bundles across three calls with different fields= and responseContentFormat= filters, which read as the payload can't be narrowed at the source. I wrote that into two agent contracts in as many words.
The awkward part is that Atlassian had shipped a fix ten days earlier, on 26 June 2026. My probe should have caught it and didn't. I still can't tell you why — the likeliest explanation is that my connector was still on a pre-fix build, and two Atlassian infrastructure changes landed that same week. What I did instead of chasing it down was take the byte-identical result at face value for three more weeks, and that's the mistake. How a claim expires without telling you is a post of its own, and it's the one I'm writing next.
What matters here is what the parameter buys once it works. Paired probe, 28 July 2026, same query with and without a narrow fields= list:
| narrowed | default | |
|---|---|---|
| single issue | 5,973 B / 6 fields | 7,410 B / 13 fields |
| 50-issue search | 293,541 B / 7 fields | 368,060 B / 13 fields |
About 20% on both endpoints. Not more, because in my probe four fields came back whether or not I asked for them — description, issuetype, project, assignee — which is not what the fix comment describes. And that forced set contains the field that dominates the payload. description alone was 39% of the narrowed single-issue payload and 44% of the narrowed search.
Against that, here is the same 50-issue result set projected down to flat scalar fields: 9,197 bytes, against 293,541 narrowed and 368,060 raw. That's 31.9× in bytes measured against the narrowed payload, the conservative baseline. Against the default it's 40×.
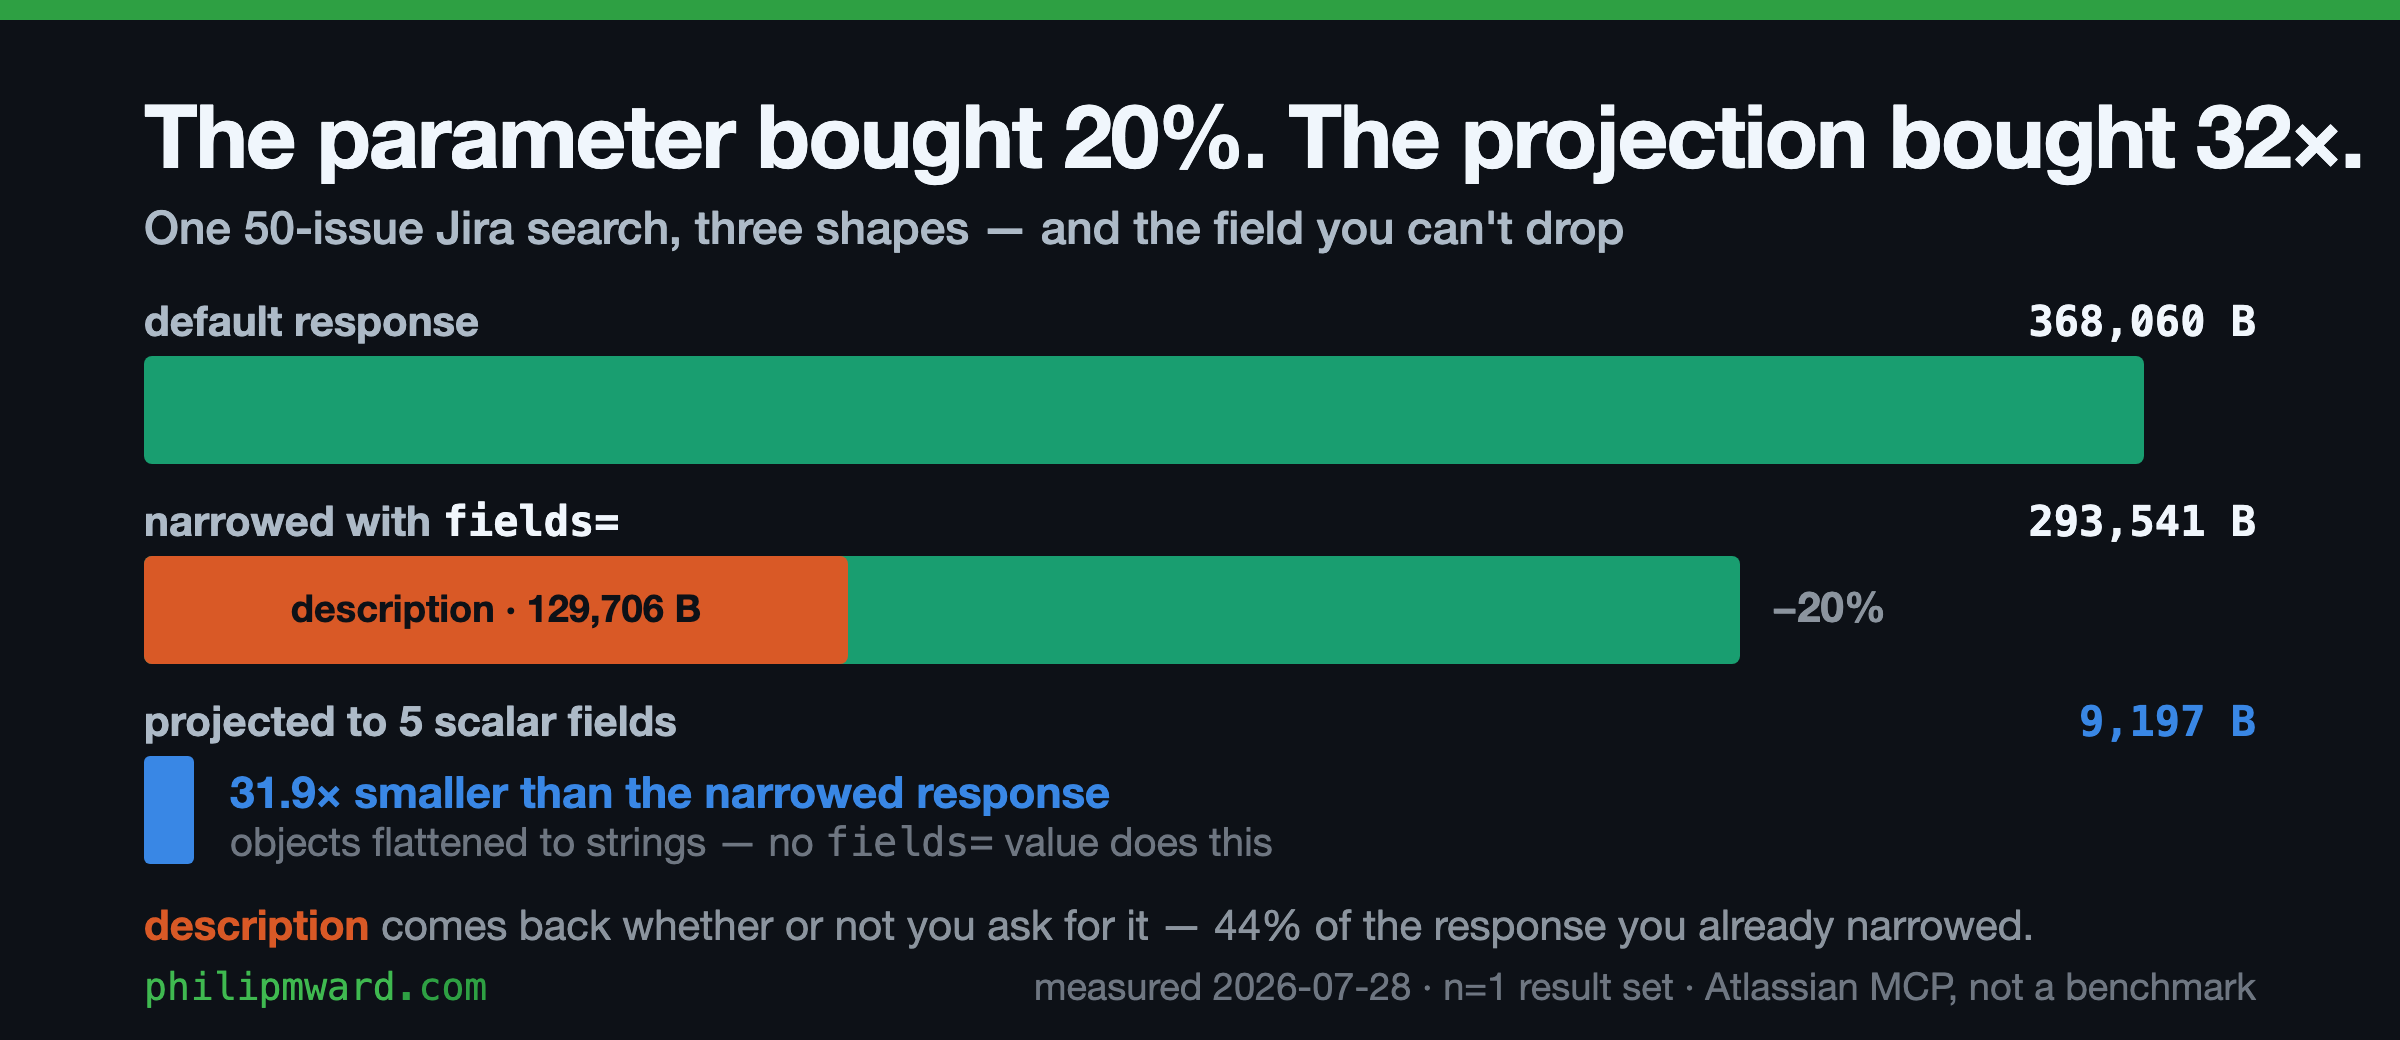
Two things are happening at once there, and it's worth separating them.
The projection flattens objects to strings, which no parameter does:
| field | as the API returns it | flattened to a display name |
|---|---|---|
assignee |
53,874 B | 687 B (78×) |
status |
23,442 B | 398 B (59×) |
Every person and every project arrives as an object dragging a set of avatar URLs at several densities. You do not want the avatars, and no fields= value gets you the name without them. That isn't my inference — it's in the same comment that shipped the fix, as a stated limitation: "Today's reduction works by picking which top-level fields come back. It does not yet prune nested properties inside a field (for example, the nested status category, or icon and avatar URLs inside a project or assignee object)."
The second thing is that this particular projection drops description outright. At 9,197 bytes across 50 issues it can't be doing anything else — that's 184 bytes an issue. Split the two apart and dropping description accounts for 1.8× of the total, while the flattening accounts for the other 17.8×. So the flattening is where the compression actually lives. The dropped field is still the more interesting half, because a projection can express "I don't need the prose for this job" and the API has no way to say that at all.
Different projections make different calls. The single-issue extractor keeps description, because a planning run needs it. That matters for the arithmetic below: 31.9× is the bulk projection's ratio. The extractor inside /plan, whose payback I work out in the next section, keeps the prose, so its ratio is lower and I haven't measured it.
So the vendor documented, on the day they shipped, exactly the gap the projection layer fills. Which leaves the extractor where it started, plus the parameter a wrong premise had talked me out of:
Pass fields= anyway. About 20%, for the cost of typing an argument. Cheap when honored, harmless when not. It went into the fetch on 28 July, three weeks after a wrong premise talked me out of it. I have no post-change measurement yet, and 20% of the fetch is not 20% of the run — the fetch is one payload among several in a /plan context.
Keep the projection. It's the order-of-magnitude win and it was never fields=-dependent. Narrowing shrinks the fat side by 20%, which barely moves the compression ratio the extractor's payback depends on. The two were never competing.
The other reasons never depended on cost at all. The extractor runs the fetch in a throwaway context, so a large payload doesn't accumulate in a long-lived session and doesn't get re-transmitted to every downstream agent that session spawns. On the bulk path it also narrows the injection surface, since a projection to scalar fields drops the prose entirely. That doesn't hold for the single-issue extractor, which keeps description and hands the caller external text either way.
The cost justification narrowed. It did not vanish. Conflating those would have had me delete working infrastructure over a percentage.
When does an extractor earn its keep?
An extractor pays for itself once the payload gets forwarded more than 2/(r − 1) times, where r is how much your projection compresses the payload. Measure r in tokens, not bytes. Dense JSON and markdown prose don't tokenize at the same rate, and my two fixtures came out 4% and 17% higher in tokens than their byte ratios suggested. I can't tell you which way yours will land, only that a byte ratio is the wrong input to this formula — and the formula is most sensitive at low r, which is exactly where you'll be tempted to eyeball it.
Count N as the number of contexts that receive the payload after the caller. Each sub-agent spawn is one.
The premise that makes this work is easy to miss. An extractor doesn't make the fat read cheaper. It moves it into a context you throw away. The caller's shrink is a relocation, not a saving, which is exactly why a payload that never gets forwarded gains nothing.
I have no production measurement of the fan-out, so I built a synthetic harness instead: vendor-neutral payloads rather than Jira ones, at two compression ratios, measuring the token cost of a context receiving the fat document, a context receiving the slim projection, and the extraction step itself. Our own setup, synthetic workload. The fat and slim cells are n=1 but near-deterministic (the baseline reproduced within 0.4% across six sessions, and the projections within 0.7%). The extractor's overhead is n=2 per ratio and it's the noisy one.
compression r |
fat tokens | slim tokens | crossover |
|---|---|---|---|
| 6.19 | 13,294 | 2,149 | forward once |
| 2.31 | 12,882 | 5,578 | forward twice (three if your extractor is chatty) |
Each downstream context pays its own cache write, so forwarding slim instead of fat saves N × (F − S). Against that sits a fixed cost of roughly 2S, the extractor's own cached write-back plus the caller's copy of the projection. Break even where N(F − S) > 2S, which is N > 2/(r − 1).
So a projection that cuts your payload six-fold pays back the first time you forward it. One that compresses 2.3× needs it forwarded twice. Bare halving needs three. And if you fetch a document once and never pass it on, an extractor is pure overhead at every ratio. Don't add one.
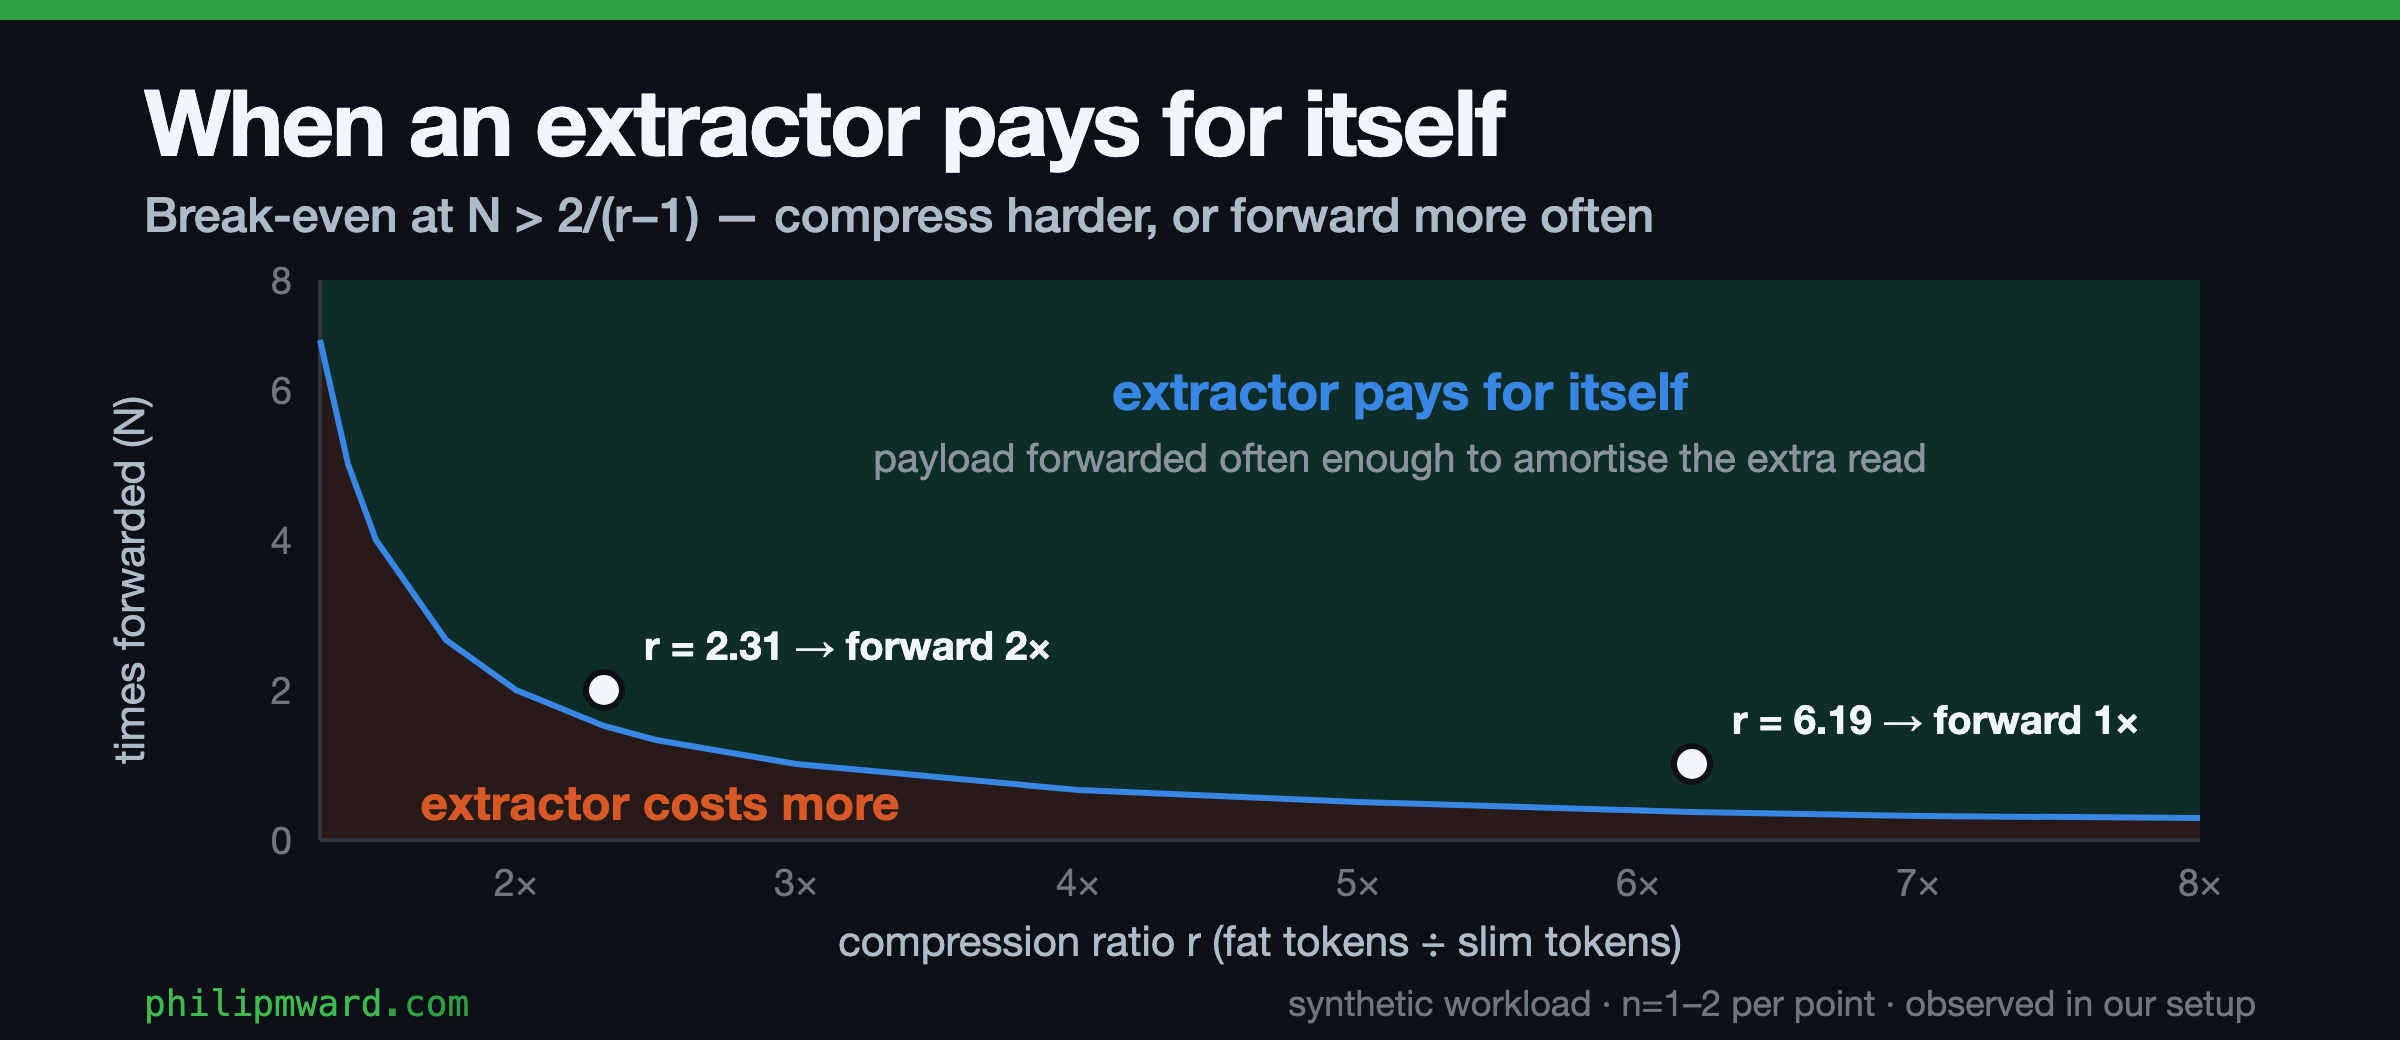
/plan forwards to six. That clears the bar at any ratio above 1.33, which is why the extractor stays even after the cost case for it narrowed — and it's why I'd have reached for one before measuring anything, if I'd counted the forwards first.
The 2S in that fixed cost is the part I'd have got wrong from the armchair. I pre-registered a prediction that the extractor's overhead would be a few hundred tokens of instructions, which would have put the threshold at 1/(r − 1). Measured, the overhead ran 0.9× to 2.0× the size of the projection, because the extractor writes its projection back and that write gets cached as well. Add the caller's own copy on top and the numerator of the rule — the whole fixed cost, measured against the projection — lands between 1.9 and 3.0. That's where the 2 comes from. E is also the noisy term. It tracked the extractor's turn count; work done barely moved it. If you're using this formula, measure that coefficient in your own setup.
What I'd take from this
The measurement was never the problem. The 97%, the 61%, the 44% all still hold, through three different explanations of the payload underneath them: that it couldn't be narrowed at the source, that it could and I'd simply never tried, and finally that it can be narrowed by about a fifth and the rest is a forced core no parameter reaches. Three stories, one set of numbers.
What I'd flag is where the evidence joins. The payload half is production-measured, on a run that forwarded the payload zero times. The forwarding half is synthetic, on vendor-neutral payloads. Nobody has measured both at once in this setup, including me.
Building that synthetic harness also turned up two bugs in my own measurement script, a double-count and a wrong subtraction basis, both inflating the fat cells. Both were in the harness, not the transcript arithmetic, so the production figures above are untouched. But both errors flattered the pattern I was advocating, and that's the direction to watch for in your own numbers, because it's the one you're least likely to check.
So:
- Check the split before you optimize anything. Add up
input_tokens + cache_creation + cache_read. If cache creation dominates, prompt-tightening is not your lever. - Try the parameter, then measure what came back. A parameter that's honored is not the same as a parameter that helped. Mine was honored and bought 20%, against a projection worth an order of magnitude more.
- Count the forwards before you build the extractor.
N > 2/(r − 1), withrin tokens. The 2 is the whole fixed cost measured against the projection, and mine ran 1.9 to 3.0 — measure it rather than trust it. Fetched once and never passed on, an extractor is pure overhead.
Agent cost is death by a thousand fat payloads. You don't prompt your way out of that.
FAQ
Does a smaller prompt always mean a cheaper agent run?
No. In our setup, input and output together were about 3% of one run's token cost, and cache traffic was the other 97%. But cache traffic isn't waste — that same run would have billed near 10M uncached, so the cache was buying a 4× discount. The lever isn't whether you cache. It's the size of the thing you're paying to write, times how many contexts you write it into.
When is an extraction sub-agent not worth adding?
When the payload is fetched once and never forwarded to another context. A field filter on the API is worth passing regardless, but in our case it recovered 20% where a projection recovered an order of magnitude more, so it's rarely a substitute. The break-even is roughly 2/(r − 1) forwards, where r is the fat-to-slim compression ratio in tokens. The 2 is the extractor's fixed cost measured against the projection, and it's worth measuring rather than assuming — ours ran 1.9 to 3.0.